


Unemployment: Unending Predicament
Linking unemployment and fall in demand

Hi,
For this post, let’s backtrack a little. It was February 2019 and the leaked report of the periodic labour force survey was making the news. It was only in May 2019 that the government released the report. And it confirmed that unemployment was at a 45 year high.
Many learned economists have said that it is the lack of demand that currently plagues the economy, not so much the constrains from the supply side.
One of the major reasons that lead to demand constrains is unemployment and stagnant wages. Conceded that it does not cause a sudden fall in the growth of the economy, but India’s growth rate has been tapering for over two years now.
So for this post, armed with the report of the Periodic labour force survey (PLFS), lets lake a closer look at the record unemployment in our country. Hopefully, the various data slicing draws us to come insights into the state of unemployment and what needs to be done to improve it.
1. Labour force participation rate (LFPR)
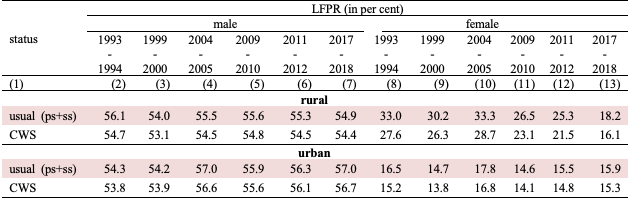
Source: PLFS-2018
Note: ss+ps & CWS are two different methods to measure the metrics. Following anyone will show the general trend without having to go in details.
The Labour force participation rate is the percentage of the population (16-64 years) that is either employed or is looking for jobs.
LFPR in the rural side has fallen to about 15-year low. This in spite of population getting younger. The LFPR ( All India ) fell to 49.8 % in 2018 from about 55.9% in 2011. This shows a clear failure in tapping into the demographic dividend and it has only gotten worse in the last 6 years. For comparison, the USA had about 63% of LFPR. This is even with their population getting steadily older. It can also be seen that the labour participation of women has sharply dipped in the last decade.
2. Worker Population Ratio (WPR)

Source: PLFS-2018
The WPR is the persons employed among the entire population.
Correspondingly, the above table shows the data for WPR in 2018. The WPR for rural area was about 40% while for urban places it was 36% in 2011 . The results for all-idnia show that only about 34.7 % of the population is employed in 2018, reducing from 39% in 2011.
This combined with the LFPR shows that not only people who are available for employment has fallen, but within that, those who are currently employed have also fallen between the two survey ( 2011 & 2018 ) years.
3. Absolute labour force numbers
One of the said arguments for a fall in the WPR or LFPR is that our population comprising of 16 years old or younger has grown a faster rate and covers a larger share compared to the past, thus reducing the WPR. To rest this argument, let us have a look at the absolute number of the labour force.
The total number of seeking workers was 472.5 million in 2012. Astonishingly, this number fell to 457 million in 2018. The absolute number of workers actually fell by over 15 million during this period. In all the previous NSSO surveys done on employment, there was never a fall in the labour force even though the population under the bracket kept increasing. This time the working population increased by 45 million yet there is a fall. This is majorly driven by women moving out of the labour force.
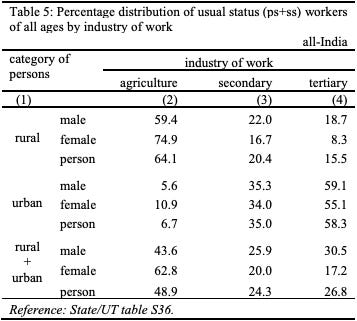
4. Split-up of the workforce by industry
So, the proportion of people who actually work has fallen. But what about the quality of jobs? If the quality of jobs had improved and was paying higher, I would accuse not many from a family would be required to work and hence a fall in the proportion of people seeking jobs. The numbers pan out as below.
The following are the number for 2012
Source: PLFS 2012
For 2018, the following

Source : PLFS 2018
The workforce has moved from agriculture to the tertiary sector. Which can be a good sign that more people are moving out of agriculture, which already has the disguised employment problem, into more productive tertiary industry jobs. Also, as agri starts using more machinery, it can become more productive and thus would need fewer people. An advanced economy like the USA has less than 3% of population in agriculture.
But the problem here is not all agri jobs are bad, neither do all the jobs in the tertiary sector provide better pay than the agri jobs. Over 70 % of those in the tertiary industry are employed in the low paying- low skill jobs.
5. The Self- Employed
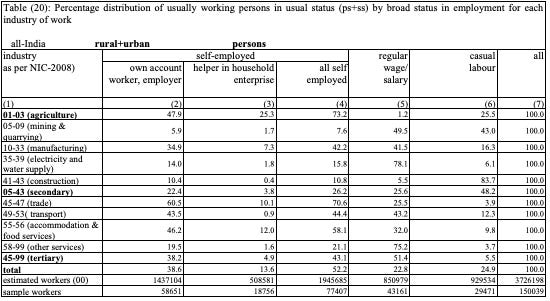
Source: PLFS, 2018
It can be seen that over 52.3 % of the population is self-employed while those in casual labour is about 24.9%. Self-employed might seem like someone who owns their land/business and thus provide employment. Enterprise is good but the number is a bit misleading. Only about 4% of the self- employed actually provide employment.
This article in Mint covers the problems of the self-employed in much detail. I have borrowed a few results from their research to present as below.
5a. Women are mostly helpers and not owners. This coupled with a fall in WPR is worrisome.

5.b The following table shows the income of the self-employed.
Over 80% of those self-employed earn less than Rs. 15000 a month.
The self-employed themselves earn less and do not hire many workers. So, in spite of a higher proportion of self-employed people, these do not add much to productivity or growth.
6. Wages
The earnings of the self-employed was discussed above. Now, let’s see how the numbers look for those in casual labour and those who are regular waged salaried employees.
For those engaged in salaried jobs, the following table shows the wages for 2011, 2017. To compare, I have adjusted the wages for inflation in the period.

Source: Author’s calculations based on PLFS, 2012
The numbers for those engaged in casual labour are as follows:

Source: Author’s calculations based on PLFS, 2018
In short, it can be seen that wages have almost remained flat when adjusted for inflation. This indicates that the fall in WPR is not because of greater prosperity, leading fewer people in the family required to work.
Summary
So, stitching it all together, a LFPR that is at over a 15 year low, a dipping WPR, absolute fall in millions of workers combined with the low prosperity of those self-employed might lead to a dangerous conclusion that people are just not opting to work mainly because they do not think they can get jobs, while those employed are not seeing growth in real wages.
Stagnant wages and low job creation link closely to the unravelling of the fall in demand in the last few years and leads it up to the present economic slowdown.
Though the cut in corporate tax rates might result in increased employment in the medium to long term, the government must also invest heavily in up-skilling the job seekers to be able to find employment. There is much to discuss about the unemployment data and the up-skilling initiatives of the government. More on them in a future post.
Regards,
Bheem
Disclaimer: All the views expressed above belong solely to the author, and do not represent those of the organisation he works in.
The Duologue is an effort by Vivek and Bheem to have a dialogue about varying topics.
If you liked what you read, you can subscribe to our newsletter.
Share it around if you find any of this piqued your interest or might be interesting for your peers.